
Prometheus 监控平台简介#
什么是 Prometheus#
Prometheus 是由 SoundCloud 开发并贡献给 CNCF(Cloud Native Computing Foundation)的开源监控和告警系统。作为云原生监控的事实标准,Prometheus 为现代化的微服务架构和容器化环境提供了强大的监控能力。
核心特性#
- 多维数据模型:基于时间序列的数据模型,使用标签(labels)进行多维度标识
- 强大的查询语言:PromQL 提供灵活的数据查询、聚合和计算功能
- 无依赖存储:内置时序数据库,单节点自主运行,无需外部依赖
- Pull 模式采集:主动拉取模式,支持服务发现和动态配置
- 推送网关支持:通过 Pushgateway 支持短期作业和批处理任务
- 丰富的生态系统:大量官方和第三方 Exporter,覆盖各种监控场景
- 高效存储:采用高效的压缩算法,优化存储空间和查询性能
应用场景#
- 基础设施监控:服务器、网络设备、存储系统的性能监控
- 应用程序监控:Web 服务、数据库、消息队列等应用组件监控
- 业务指标监控:用户行为、业务流程、KPI 指标的实时监控
- 容器和微服务监控:Kubernetes、Docker 等容器化环境的全栈监控
- SLI/SLO 监控:服务等级指标和目标的持续监控和告警
架构设计#
单机架构#
flowchart TB
    subgraph Prometheus[Prometheus Server]
        direction TB
        A[Web UI]
        B[HTTP API]
        C[PromQL Engine]
        D[Retrieval]
        E[TSDB]
        F[Rule Engine]
        G[Service Discovery]
        H[Scrape Targets]
    end

    I1[Node Exporter]
    I2[App Metrics]
    I3[Custom Exporter]

    G --> I1
    G --> I2
    G --> I3
企业级高可用架构#
flowchart TB
    LB[Load Balancer]

    P1[Prometheus Server 1]
    P2[Prometheus Server 2]
    P3[Prometheus Server 3]

    LB --> P1
    LB --> P2
    LB --> P3

    AM1[AlertManager Cluster]
    AM2[AlertManager Cluster]

    P1 --> AM1
    P2 --> AM1
    P3 --> AM2

    G[Grafana Visualization]

    AM1 --> G
    AM2 --> G
环境准备#
系统要求#
硬件要求#
| 环境类型 | CPU | 内存 | 存储 | 网络 | 说明 |
|---|---|---|---|---|---|
| 开发环境 | 2 核 | 4GB | 50GB | 1Gbps | 小规模测试 |
| 测试环境 | 4 核 | 8GB | 200GB | 1Gbps | 中等规模测试 |
| 生产环境 | 8 核 | 16GB+ | 1TB+ | 10Gbps | 大规模生产 |
| 大型企业 | 16 核 | 32GB+ | 5TB+ | 10Gbps | 超大规模部署 |
软件要求#
| 组件 | 最低版本 | 推荐版本 | 说明 |
|---|---|---|---|
| 操作系统 | CentOS 7.6 | CentOS 8+ / Ubuntu 20.04+ | 64位系统 |
| Prometheus | 2.30.0 | 2.45.0+ | 监控服务器 |
| AlertManager | 0.24.0 | 0.26.0+ | 告警管理器 |
| Node Exporter | 1.3.0 | 1.6.0+ | 系统监控 |
| Grafana | 8.0.0 | 10.0.0+ | 可视化面板 |
网络端口规划#
| 端口 | 服务 | 协议 | 说明 |
|---|---|---|---|
| 9090 | Prometheus | TCP | Web UI 和 API |
| 9093 | AlertManager | TCP | 告警管理界面 |
| 9094 | AlertManager | TCP | 集群通信端口 |
| 9100 | Node Exporter | TCP | 系统指标收集 |
| 9115 | Blackbox Exporter | TCP | 黑盒监控 |
| 3000 | Grafana | TCP | 可视化界面 |
环境检查脚本#
cat > check-prometheus-env.sh << 'EOF'
#!/bin/bash

echo "=== Prometheus 环境检查脚本 ==="
echo "检查时间: $(date)"
echo

# 检查操作系统
echo "=== 系统信息 ==="
cat /etc/redhat-release 2>/dev/null || lsb_release -a 2>/dev/null
uname -a
echo

# 检查内存
echo "=== 内存信息 ==="
free -h
TOTAL_MEM=$(free -m | awk 'NR==2{printf "%.0f", $2}')
if [ $TOTAL_MEM -lt 4096 ]; then
    echo "⚠ 警告: 内存不足 4GB,可能影响 Prometheus 性能"
else
    echo "✓ 内存充足"
fi
echo

# 检查磁盘空间
echo "=== 磁盘空间 ==="
df -h
DISK_USAGE=$(df / | awk 'NR==2 {print $5}' | sed 's/%//')
if [ $DISK_USAGE -gt 80 ]; then
    echo "⚠ 警告: 磁盘使用率超过 80%"
else
    echo "✓ 磁盘空间充足"
fi
echo

# 检查网络端口
echo "=== 端口检查 ==="
for port in 9090 9093 9100 3000; do
    if netstat -tlnp | grep :$port >/dev/null 2>&1; then
        echo "⚠ 端口 $port 已被占用"
        netstat -tlnp | grep :$port
    else
        echo "✓ 端口 $port 可用"
    fi
done
echo

# 检查时间同步
echo "=== 时间同步检查 ==="
if command -v chrony >/dev/null 2>&1; then
    chrony sources -v
    echo "✓ Chrony 时间同步服务运行正常"
elif command -v ntpq >/dev/null 2>&1; then
    ntpq -p
    echo "✓ NTP 时间同步服务运行正常"
else
    echo "⚠ 未检测到时间同步服务"
fi
echo

# 检查防火墙状态
echo "=== 防火墙状态 ==="
if systemctl is-active --quiet firewalld; then
    echo "防火墙状态: 启用"
    firewall-cmd --list-ports
elif systemctl is-active --quiet iptables; then
    echo "防火墙状态: iptables 启用"
else
    echo "防火墙状态: 禁用"
fi
echo

echo "=== 环境检查完成 ==="
EOF

chmod +x check-prometheus-env.sh
./check-prometheus-env.sh
系统优化配置#
内核参数优化#
# 创建系统优化脚本
cat > optimize-system.sh << 'EOF'
#!/bin/bash

echo "=== 系统优化配置 ==="

# 优化文件描述符限制
cat >> /etc/security/limits.conf << 'LIMITS'
prometheus soft nofile 65536
prometheus hard nofile 65536
alertmanager soft nofile 65536
alertmanager hard nofile 65536
LIMITS

# 优化内核参数
cat >> /etc/sysctl.conf << 'SYSCTL'
# Prometheus 优化参数
vm.max_map_count = 262144
vm.swappiness = 1
net.core.somaxconn = 65535
net.ipv4.tcp_max_syn_backlog = 65535
net.core.netdev_max_backlog = 5000
net.ipv4.tcp_fin_timeout = 30
net.ipv4.tcp_keepalive_time = 1200
net.ipv4.tcp_keepalive_probes = 3
net.ipv4.tcp_keepalive_intvl = 15
SYSCTL

# 应用内核参数
sysctl -p

# 禁用 SELinux(可选)
if getenforce | grep -q "Enforcing"; then
    echo "禁用 SELinux..."
    setenforce 0
    sed -i 's/SELINUX=enforcing/SELINUX=disabled/g' /etc/selinux/config
fi

# 配置时间同步
if ! systemctl is-active --quiet chronyd; then
    echo "配置时间同步..."
    yum install -y chrony
    systemctl enable chronyd
    systemctl start chronyd
fi

echo "✓ 系统优化完成"
EOF

chmod +x optimize-system.sh
./optimize-system.sh
Prometheus 部署实施#
方案一:二进制部署(推荐)#
步骤 1:下载和安装 Prometheus#
# 创建安装脚本
cat > install-prometheus.sh << 'EOF'
#!/bin/bash

PROMETHEUS_VERSION="2.45.0"
ALERTMANAGER_VERSION="0.26.0"
NODE_EXPORTER_VERSION="1.6.0"
BLACKBOX_EXPORTER_VERSION="0.24.0"

INSTALL_DIR="/usr/local"
CONFIG_DIR="/etc/prometheus"
DATA_DIR="/var/lib/prometheus"
LOG_DIR="/var/log/prometheus"

echo "=== Prometheus 安装脚本 ==="

# 创建用户和目录
create_users_and_dirs() {
    echo "创建用户和目录..."

    # 创建用户
    useradd --no-create-home --shell /bin/false prometheus
    useradd --no-create-home --shell /bin/false alertmanager
    useradd --no-create-home --shell /bin/false node_exporter

    # 创建目录
    mkdir -p $CONFIG_DIR/{rules,targets,alertmanager,templates}
    mkdir -p $DATA_DIR/{prometheus,alertmanager}
    mkdir -p $LOG_DIR

    # 设置权限
    chown -R prometheus:prometheus $CONFIG_DIR
    chown -R prometheus:prometheus $DATA_DIR/prometheus
    chown -R alertmanager:alertmanager $CONFIG_DIR/alertmanager
    chown -R alertmanager:alertmanager $DATA_DIR/alertmanager
    chown -R prometheus:prometheus $LOG_DIR
}

# 下载和安装 Prometheus
install_prometheus() {
    echo "安装 Prometheus $PROMETHEUS_VERSION..."

    cd /tmp
    wget https://github.com/prometheus/prometheus/releases/download/v$PROMETHEUS_VERSION/prometheus-$PROMETHEUS_VERSION.linux-amd64.tar.gz
    tar xf prometheus-$PROMETHEUS_VERSION.linux-amd64.tar.gz

    # 复制二进制文件
    cp prometheus-$PROMETHEUS_VERSION.linux-amd64/prometheus $INSTALL_DIR/bin/
    cp prometheus-$PROMETHEUS_VERSION.linux-amd64/promtool $INSTALL_DIR/bin/

    # 复制配置文件和模板
    cp prometheus-$PROMETHEUS_VERSION.linux-amd64/prometheus.yml $CONFIG_DIR/
    cp -r prometheus-$PROMETHEUS_VERSION.linux-amd64/consoles $CONFIG_DIR/
    cp -r prometheus-$PROMETHEUS_VERSION.linux-amd64/console_libraries $CONFIG_DIR/

    # 设置权限
    chmod +x $INSTALL_DIR/bin/prometheus
    chmod +x $INSTALL_DIR/bin/promtool
    chown -R prometheus:prometheus $CONFIG_DIR

    # 清理
    rm -rf prometheus-$PROMETHEUS_VERSION.linux-amd64*
}

# 下载和安装 AlertManager
install_alertmanager() {
    echo "安装 AlertManager $ALERTMANAGER_VERSION..."

    cd /tmp
    wget https://github.com/prometheus/alertmanager/releases/download/v$ALERTMANAGER_VERSION/alertmanager-$ALERTMANAGER_VERSION.linux-amd64.tar.gz
    tar xf alertmanager-$ALERTMANAGER_VERSION.linux-amd64.tar.gz

    # 复制二进制文件
    cp alertmanager-$ALERTMANAGER_VERSION.linux-amd64/alertmanager $INSTALL_DIR/bin/
    cp alertmanager-$ALERTMANAGER_VERSION.linux-amd64/amtool $INSTALL_DIR/bin/

    # 设置权限
    chmod +x $INSTALL_DIR/bin/alertmanager
    chmod +x $INSTALL_DIR/bin/amtool

    # 清理
    rm -rf alertmanager-$ALERTMANAGER_VERSION.linux-amd64*
}

# 下载和安装 Node Exporter
install_node_exporter() {
    echo "安装 Node Exporter $NODE_EXPORTER_VERSION..."

    cd /tmp
    wget https://github.com/prometheus/node_exporter/releases/download/v$NODE_EXPORTER_VERSION/node_exporter-$NODE_EXPORTER_VERSION.linux-amd64.tar.gz
    tar xf node_exporter-$NODE_EXPORTER_VERSION.linux-amd64.tar.gz

    # 复制二进制文件
    cp node_exporter-$NODE_EXPORTER_VERSION.linux-amd64/node_exporter $INSTALL_DIR/bin/

    # 设置权限
    chmod +x $INSTALL_DIR/bin/node_exporter

    # 创建文本收集器目录
    mkdir -p /var/lib/node_exporter/textfile_collector
    chown -R node_exporter:node_exporter /var/lib/node_exporter

    # 清理
    rm -rf node_exporter-$NODE_EXPORTER_VERSION.linux-amd64*
}

# 下载和安装 Blackbox Exporter
install_blackbox_exporter() {
    echo "安装 Blackbox Exporter $BLACKBOX_EXPORTER_VERSION..."

    cd /tmp
    wget https://github.com/prometheus/blackbox_exporter/releases/download/v$BLACKBOX_EXPORTER_VERSION/blackbox_exporter-$BLACKBOX_EXPORTER_VERSION.linux-amd64.tar.gz
    tar xf blackbox_exporter-$BLACKBOX_EXPORTER_VERSION.linux-amd64.tar.gz

    # 复制二进制文件
    cp blackbox_exporter-$BLACKBOX_EXPORTER_VERSION.linux-amd64/blackbox_exporter $INSTALL_DIR/bin/
    cp blackbox_exporter-$BLACKBOX_EXPORTER_VERSION.linux-amd64/blackbox.yml $CONFIG_DIR/

    # 设置权限
    chmod +x $INSTALL_DIR/bin/blackbox_exporter
    chown prometheus:prometheus $CONFIG_DIR/blackbox.yml

    # 清理
    rm -rf blackbox_exporter-$BLACKBOX_EXPORTER_VERSION.linux-amd64*
}

# 验证安装
verify_installation() {
    echo "验证安装..."

    for binary in prometheus promtool alertmanager amtool node_exporter blackbox_exporter; do
        if command -v $binary >/dev/null 2>&1; then
            echo "✓ $binary 安装成功"
            $binary --version | head -1
        else
            echo "✗ $binary 安装失败"
        fi
    done
}

# 主安装流程
main() {
    create_users_and_dirs
    install_prometheus
    install_alertmanager
    install_node_exporter
    install_blackbox_exporter
    verify_installation

    echo "✓ Prometheus 监控组件安装完成"
    echo "配置目录: $CONFIG_DIR"
    echo "数据目录: $DATA_DIR"
    echo "日志目录: $LOG_DIR"
}

main "$@"
EOF

chmod +x install-prometheus.sh
./install-prometheus.sh
步骤 2:配置环境变量#
# 添加到系统 PATH
cat >> /etc/profile << 'EOF'
# Prometheus 环境变量
export PATH=/usr/local/bin:$PATH
export PROMETHEUS_CONFIG_DIR=/etc/prometheus
export PROMETHEUS_DATA_DIR=/var/lib/prometheus
EOF

# 重新加载环境变量
source /etc/profile

# 验证安装
prometheus --version
alertmanager --version
node_exporter --version
步骤 3:配置 Prometheus#
创建生产级配置文件#
cat > /etc/prometheus/prometheus.yml << 'EOF'
# Prometheus 全局配置
global:
  scrape_interval: 15s          # 默认抓取间隔
  evaluation_interval: 15s      # 规则评估间隔
  scrape_timeout: 10s           # 抓取超时时间

  # 外部标签(用于联邦和远程存储)
  external_labels:
    cluster: 'production'
    region: 'cn-north-1'
    datacenter: 'dc1'
    environment: 'prod'

# 告警管理器配置
alerting:
  alertmanagers:
    - static_configs:
        - targets:
          - localhost:9093
      timeout: 10s
      api_version: v2
      path_prefix: /

# 规则文件配置
rule_files:
  - "rules/*.yml"

# 远程写入配置(可选)
# remote_write:
#   - url: "http://remote-storage:9201/write"
#     queue_config:
#       max_samples_per_send: 1000
#       max_shards: 200
#       capacity: 2500

# 远程读取配置(可选)
# remote_read:
#   - url: "http://remote-storage:9201/read"

# 抓取配置
scrape_configs:
  # Prometheus 自监控
  - job_name: 'prometheus'
    static_configs:
      - targets: ['localhost:9090']
        labels:
          service: 'prometheus'
          team: 'infrastructure'
    scrape_interval: 15s
    metrics_path: /metrics

  # AlertManager 监控
  - job_name: 'alertmanager'
    static_configs:
      - targets: ['localhost:9093']
        labels:
          service: 'alertmanager'
          team: 'infrastructure'
    scrape_interval: 15s

  # Node Exporter 监控(文件服务发现)
  - job_name: 'node-exporter'
    file_sd_configs:
      - files:
          - 'targets/nodes/*.json'
        refresh_interval: 30s
    scrape_interval: 30s
    metrics_path: /metrics

    # 指标重新标记
    metric_relabel_configs:
      # 删除不需要的指标
      - source_labels: [__name__]
        regex: 'node_scrape_collector_.*'
        action: drop
      - source_labels: [__name__]
        regex: 'node_textfile_scrape_error'
        action: drop

  # 黑盒监控
  - job_name: 'blackbox-http'
    metrics_path: /probe
    params:
      module: [http_2xx]
    file_sd_configs:
      - files:
          - 'targets/blackbox/*.json'
        refresh_interval: 30s
    relabel_configs:
      - source_labels: [__address__]
        target_label: __param_target
      - source_labels: [__param_target]
        target_label: instance
      - target_label: __address__
        replacement: localhost:9115

  # 数据库监控
  - job_name: 'mysql-exporter'
    file_sd_configs:
      - files:
          - 'targets/mysql/*.json'
        refresh_interval: 30s
    scrape_interval: 30s

  - job_name: 'redis-exporter'
    file_sd_configs:
      - files:
          - 'targets/redis/*.json'
        refresh_interval: 30s
    scrape_interval: 30s

  # 应用监控
  - job_name: 'application-metrics'
    file_sd_configs:
      - files:
          - 'targets/applications/*.json'
        refresh_interval: 30s
    scrape_interval: 15s
    metrics_path: /metrics

  # Kubernetes 监控(如果适用)
  # - job_name: 'kubernetes-pods'
  #   kubernetes_sd_configs:
  #     - role: pod
  #   relabel_configs:
  #     - source_labels: [__meta_kubernetes_pod_annotation_prometheus_io_scrape]
  #       action: keep
  #       regex: true
EOF

# 设置配置文件权限
chown prometheus:prometheus /etc/prometheus/prometheus.yml
chmod 640 /etc/prometheus/prometheus.yml
创建服务发现目标文件#
# 创建节点监控目标
mkdir -p /etc/prometheus/targets/{nodes,blackbox,mysql,redis,applications}

# 节点监控配置
cat > /etc/prometheus/targets/nodes/production.json << 'EOF'
[
  {
    "targets": [
      "localhost:9100",
      "web-server-01:9100",
      "web-server-02:9100",
      "db-server-01:9100"
    ],
    "labels": {
      "environment": "production",
      "datacenter": "dc1",
      "team": "infrastructure",
      "service": "system"
    }
  }
]
EOF

# 黑盒监控配置
cat > /etc/prometheus/targets/blackbox/websites.json << 'EOF'
[
  {
    "targets": [
      "https://www.example.com",
      "https://api.example.com",
      "http://internal-service:8080/health"
    ],
    "labels": {
      "environment": "production",
      "monitor_type": "http",
      "team": "sre"
    }
  }
]
EOF

# 设置权限
chown -R prometheus:prometheus /etc/prometheus/targets/
验证配置文件#
# 检查配置文件语法
promtool check config /etc/prometheus/prometheus.yml

# 预期输出:
# Checking /etc/prometheus/prometheus.yml
#   SUCCESS: 0 rule files found

# 检查服务发现配置
promtool query instant 'up' --config.file=/etc/prometheus/prometheus.yml
步骤 4:配置系统服务#
创建 Prometheus 系统服务#
cat > /etc/systemd/system/prometheus.service << 'EOF'
[Unit]
Description=Prometheus Server
Documentation=https://prometheus.io/docs/
After=network-online.target
Wants=network-online.target

[Service]
Type=simple
User=prometheus
Group=prometheus
ExecReload=/bin/kill -HUP $MAINPID
ExecStart=/usr/local/bin/prometheus \
  --config.file=/etc/prometheus/prometheus.yml \
  --storage.tsdb.path=/var/lib/prometheus \
  --storage.tsdb.retention.time=30d \
  --storage.tsdb.retention.size=50GB \
  --storage.tsdb.wal-compression \
  --web.console.templates=/etc/prometheus/consoles \
  --web.console.libraries=/etc/prometheus/console_libraries \
  --web.listen-address=0.0.0.0:9090 \
  --web.external-url=http://localhost:9090 \
  --web.enable-lifecycle \
  --web.enable-admin-api \
  --web.max-connections=512 \
  --query.max-concurrency=20 \
  --query.timeout=2m \
  --log.level=info \
  --log.format=logfmt

SyslogIdentifier=prometheus
Restart=always
RestartSec=5
LimitNOFILE=65536
LimitNPROC=65536

# 安全配置
NoNewPrivileges=true
ProtectSystem=strict
ProtectHome=true
ReadWritePaths=/var/lib/prometheus

[Install]
WantedBy=multi-user.target
EOF
创建 Node Exporter 系统服务#
cat > /etc/systemd/system/node_exporter.service << 'EOF'
[Unit]
Description=Node Exporter
Documentation=https://prometheus.io/docs/guides/node-exporter/
After=network-online.target
Wants=network-online.target

[Service]
Type=simple
User=node_exporter
Group=node_exporter
ExecStart=/usr/local/bin/node_exporter \
  --web.listen-address=0.0.0.0:9100 \
  --path.procfs=/proc \
  --path.sysfs=/sys \
  --collector.filesystem.ignored-mount-points="^/(sys|proc|dev|host|etc|rootfs/var/lib/docker/containers|rootfs/var/lib/docker/overlay2|rootfs/run/docker/netns|rootfs/var/lib/docker/aufs)($$|/)" \
  --collector.filesystem.ignored-fs-types="^(autofs|binfmt_misc|bpf|cgroup2?|configfs|debugfs|devpts|devtmpfs|fusectl|hugetlbfs|iso9660|mqueue|nsfs|overlay|proc|procfs|pstore|rpc_pipefs|securityfs|selinuxfs|squashfs|sysfs|tracefs)$$" \
  --collector.textfile.directory=/var/lib/node_exporter/textfile_collector \
  --collector.systemd \
  --collector.systemd.unit-whitelist="(sshd|nginx|docker|mysql|redis|postgresql)\.service" \
  --collector.processes \
  --collector.tcpstat \
  --log.level=info

SyslogIdentifier=node_exporter
Restart=always
RestartSec=5
LimitNOFILE=65536

# 安全配置
NoNewPrivileges=true
ProtectSystem=strict
ProtectHome=true
ReadWritePaths=/var/lib/node_exporter

[Install]
WantedBy=multi-user.target
EOF
创建 Blackbox Exporter 系统服务#
cat > /etc/systemd/system/blackbox_exporter.service << 'EOF'
[Unit]
Description=Blackbox Exporter
Documentation=https://github.com/prometheus/blackbox_exporter
After=network-online.target
Wants=network-online.target

[Service]
Type=simple
User=prometheus
Group=prometheus
ExecStart=/usr/local/bin/blackbox_exporter \
  --config.file=/etc/prometheus/blackbox.yml \
  --web.listen-address=0.0.0.0:9115 \
  --log.level=info

SyslogIdentifier=blackbox_exporter
Restart=always
RestartSec=5
LimitNOFILE=65536

# 安全配置
NoNewPrivileges=true
ProtectSystem=strict
ProtectHome=true

[Install]
WantedBy=multi-user.target
EOF
启动和验证服务#
# 创建服务启动脚本
cat > start-prometheus-services.sh << 'EOF'
#!/bin/bash

echo "=== 启动 Prometheus 监控服务 ==="

# 重新加载 systemd 配置
systemctl daemon-reload

# 启动服务
services=("node_exporter" "blackbox_exporter" "prometheus")

for service in "${services[@]}"; do
    echo "启动 $service..."
    systemctl start $service
    systemctl enable $service

    # 检查服务状态
    if systemctl is-active --quiet $service; then
        echo "✓ $service 启动成功"
    else
        echo "✗ $service 启动失败"
        systemctl status $service
    fi
done

# 验证端口监听
echo -e "\n=== 端口监听检查 ==="
for port in 9090 9100 9115; do
    if netstat -tlnp | grep :$port >/dev/null 2>&1; then
        echo "✓ 端口 $port 监听正常"
    else
        echo "✗ 端口 $port 未监听"
    fi
done

# 测试 Web 界面
echo -e "\n=== Web 界面测试 ==="
for url in "http://localhost:9090" "http://localhost:9100/metrics" "http://localhost:9115"; do
    if curl -s -o /dev/null -w "%{http_code}" $url | grep -q "200"; then
        echo "✓ $url 响应正常"
    else
        echo "✗ $url 响应异常"
    fi
done

echo -e "\n=== 服务启动完成 ==="
echo "Prometheus Web UI: http://localhost:9090"
echo "Node Exporter: http://localhost:9100/metrics"
echo "Blackbox Exporter: http://localhost:9115"
EOF

chmod +x start-prometheus-services.sh
./start-prometheus-services.sh
配置日志轮转#
# 创建日志轮转配置
cat > /etc/logrotate.d/prometheus << 'EOF'
/var/log/prometheus/*.log {
    daily
    missingok
    rotate 30
    compress
    delaycompress
    notifempty
    create 0644 prometheus prometheus
    postrotate
        systemctl reload prometheus
        systemctl reload alertmanager
    endscript
}
EOF
启动参数说明:
--storage.tsdb.retention.time=30d: 数据保留 30 天--storage.tsdb.retention.size=50GB: 最大存储 50GB--storage.tsdb.wal-compression: 启用 WAL 压缩--web.enable-lifecycle: 启用热重载功能--web.enable-admin-api: 启用管理 API--web.max-connections=512: 最大连接数--query.max-concurrency=20: 最大并发查询数--query.timeout=2m: 查询超时时间
第七步:配置防火墙和安全#
防火墙配置#
# 开放 Prometheus 端口
firewall-cmd --permanent --add-port=9090/tcp
firewall-cmd --reload

# 验证防火墙规则
firewall-cmd --list-ports
配置 Nginx 反向代理(推荐)#
为了增强安全性,建议使用 Nginx 作为反向代理:
# 安装 httpd-tools(用于创建认证文件)
yum install -y httpd-tools

# 创建认证文件
htpasswd -c /etc/prometheus/.htpasswd admin

# 创建 Nginx 配置
cat > /etc/nginx/conf.d/prometheus.conf << 'EOF'
upstream prometheus {
    server 127.0.0.1:9090;
}

server {
    listen 80;
    server_name prometheus.example.com;

    # 重定向到 HTTPS
    return 301 https://$server_name$request_uri;
}

server {
    listen 443 ssl http2;
    server_name prometheus.example.com;

    # SSL 配置
    ssl_certificate /etc/ssl/certs/prometheus.crt;
    ssl_certificate_key /etc/ssl/private/prometheus.key;
    ssl_protocols TLSv1.2 TLSv1.3;
    ssl_ciphers ECDHE-RSA-AES128-GCM-SHA256:ECDHE-RSA-AES256-GCM-SHA384;

    # 访问日志
    access_log /var/log/nginx/prometheus.access.log;
    error_log /var/log/nginx/prometheus.error.log;

    location / {
        auth_basic "Prometheus";
        auth_basic_user_file /etc/prometheus/.htpasswd;

        proxy_pass http://prometheus;
        proxy_set_header Host $host;
        proxy_set_header X-Real-IP $remote_addr;
        proxy_set_header X-Forwarded-For $proxy_add_x_forwarded_for;
        proxy_set_header X-Forwarded-Proto $scheme;

        # WebSocket 支持
        proxy_http_version 1.1;
        proxy_set_header Upgrade $http_upgrade;
        proxy_set_header Connection "upgrade";
    }

    # API 接口(可选择性开放)
    location /api/ {
        auth_basic "Prometheus API";
        auth_basic_user_file /etc/prometheus/.htpasswd;

        proxy_pass http://prometheus;
        proxy_set_header Host $host;
        proxy_set_header X-Real-IP $remote_addr;
        proxy_set_header X-Forwarded-For $proxy_add_x_forwarded_for;
        proxy_set_header X-Forwarded-Proto $scheme;
    }
}
EOF

# 测试 Nginx 配置
nginx -t

# 重新加载 Nginx
nginx -s reload
第八步:配置监控规则#
创建告警规则#
cat > /etc/prometheus/rules/node_alerts.yml << 'EOF'
groups:
  - name: node_alerts
    interval: 30s
    rules:
    # 实例下线告警
    - alert: InstanceDown
      expr: up == 0
      for: 1m
      labels:
        severity: critical
      annotations:
        summary: "实例 {{ $labels.instance }} 已下线"
        description: "实例 {{ $labels.instance }} 已经下线超过 1 分钟"

    # CPU 使用率告警
    - alert: HighCPUUsage
      expr: 100 - (avg by(instance) (irate(node_cpu_seconds_total{mode="idle"}[5m])) * 100) > 80
      for: 5m
      labels:
        severity: warning
      annotations:
        summary: "高 CPU 使用率"
        description: "实例 {{ $labels.instance }} CPU 使用率超过 80%,当前值: {{ $value }}%"

    # 内存使用率告警
    - alert: HighMemoryUsage
      expr: (1 - (node_memory_MemAvailable_bytes / node_memory_MemTotal_bytes)) * 100 > 85
      for: 5m
      labels:
        severity: warning
      annotations:
        summary: "高内存使用率"
        description: "实例 {{ $labels.instance }} 内存使用率超过 85%,当前值: {{ $value }}%"

    # 磁盘使用率告警
    - alert: HighDiskUsage
      expr: (1 - (node_filesystem_avail_bytes{fstype!="tmpfs"} / node_filesystem_size_bytes{fstype!="tmpfs"})) * 100 > 85
      for: 5m
      labels:
        severity: warning
      annotations:
        summary: "高磁盘使用率"
        description: "实例 {{ $labels.instance }} 磁盘 {{ $labels.mountpoint }} 使用率超过 85%,当前值: {{ $value }}%"
EOF

# 验证规则文件
/usr/local/prometheus/promtool check rules /etc/prometheus/rules/node_alerts.yml

# 重新加载 Prometheus 配置
systemctl reload prometheus
创建记录规则#
cat > /etc/prometheus/rules/recording_rules.yml << 'EOF'
groups:
  - name: recording_rules
    interval: 30s
    rules:
    # CPU 使用率记录规则
    - record: instance:node_cpu_utilization:rate5m
      expr: 100 - (avg by(instance) (irate(node_cpu_seconds_total{mode="idle"}[5m])) * 100)
      labels:
        metric_type: utilization

    # 内存使用率记录规则
    - record: instance:node_memory_utilization:ratio
      expr: (1 - (node_memory_MemAvailable_bytes / node_memory_MemTotal_bytes)) * 100
      labels:
        metric_type: utilization

    # 磁盘使用率记录规则
    - record: instance:node_filesystem_utilization:ratio
      expr: (1 - (node_filesystem_avail_bytes{fstype!="tmpfs"} / node_filesystem_size_bytes{fstype!="tmpfs"})) * 100
      labels:
        metric_type: utilization

    # 网络流量记录规则
    - record: instance:node_network_receive_bytes:rate5m
      expr: rate(node_network_receive_bytes_total[5m])
      labels:
        metric_type: traffic

    - record: instance:node_network_transmit_bytes:rate5m
      expr: rate(node_network_transmit_bytes_total[5m])
      labels:
        metric_type: traffic
EOF
AlertManager 告警管理器部署#
AlertManager 是 Prometheus 生态系统中的告警管理组件,负责处理由 Prometheus 发送的告警,并将其路由到正确的接收器。
第一步:安装 AlertManager#
下载和安装#
# 下载 AlertManager
cd /tmp
wget https://github.com/prometheus/alertmanager/releases/download/v0.24.0/alertmanager-0.24.0.linux-amd64.tar.gz

# 解压安装包
tar xf alertmanager-0.24.0.linux-amd64.tar.gz

# 复制二进制文件
cp alertmanager-0.24.0.linux-amd64/alertmanager /usr/local/bin/
cp alertmanager-0.24.0.linux-amd64/amtool /usr/local/bin/

# 设置执行权限
chmod +x /usr/local/bin/alertmanager
chmod +x /usr/local/bin/amtool

# 验证安装
alertmanager --version
创建用户和目录#
# 创建 alertmanager 用户
useradd --no-create-home --shell /bin/false alertmanager

# 创建配置和数据目录
mkdir -p /etc/alertmanager
mkdir -p /var/lib/alertmanager

# 设置目录权限
chown alertmanager:alertmanager /etc/alertmanager
chown alertmanager:alertmanager /var/lib/alertmanager
第二步:配置 AlertManager#
创建基础配置文件#
cat > /etc/alertmanager/alertmanager.yml << 'EOF'
# AlertManager 全局配置
global:
  # SMTP 配置
  smtp_smarthost: 'smtp.example.com:587'
  smtp_from: 'alerts@example.com'
  smtp_auth_username: 'alerts@example.com'
  smtp_auth_password: 'your-email-password'
  smtp_require_tls: true

  # 解决告警的超时时间
  resolve_timeout: 5m

# 模板配置
templates:
  - '/etc/alertmanager/templates/*.tmpl'

# 路由配置
route:
  # 默认接收器
  receiver: 'default'

  # 分组配置
  group_by: ['alertname', 'cluster', 'service']
  group_wait: 10s          # 等待时间
  group_interval: 10s      # 分组间隔
  repeat_interval: 1h      # 重复间隔

  # 子路由
  routes:
  # 严重告警立即发送
  - match:
      severity: critical
    receiver: 'critical-alerts'
    group_wait: 0s
    repeat_interval: 5m

  # 数据库相关告警
  - match_re:
      service: ^(mysql|postgresql|redis)$
    receiver: 'database-team'

  # 网络相关告警
  - match:
      alertname: NetworkDown
    receiver: 'network-team'

# 抑制规则
inhibit_rules:
  # 如果实例下线,抑制其他相关告警
  - source_match:
      alertname: 'InstanceDown'
    target_match_re:
      alertname: '^(HighCPUUsage|HighMemoryUsage|HighDiskUsage)$'
    equal: ['instance']

# 接收器配置
receivers:
  # 默认接收器
  - name: 'default'
    email_configs:
    - to: 'admin@example.com'
      subject: '[ALERT] {{ .GroupLabels.alertname }}'
      body: |
        {{ range .Alerts }}
        告警名称: {{ .Annotations.summary }}
        告警详情: {{ .Annotations.description }}
        告警时间: {{ .StartsAt.Format "2006-01-02 15:04:05" }}
        告警标签: {{ range .Labels.SortedPairs }}{{ .Name }}={{ .Value }} {{ end }}
        {{ end }}

  # 严重告警接收器
  - name: 'critical-alerts'
    email_configs:
    - to: 'oncall@example.com'
      subject: '[CRITICAL] {{ .GroupLabels.alertname }}'
      body: |
        🚨 严重告警 🚨

        {{ range .Alerts }}
        告警名称: {{ .Annotations.summary }}
        告警详情: {{ .Annotations.description }}
        告警时间: {{ .StartsAt.Format "2006-01-02 15:04:05" }}
        告警级别: {{ .Labels.severity }}
        影响实例: {{ .Labels.instance }}
        {{ end }}
    # 短信通知(需要配置短信网关)
    webhook_configs:
    - url: 'http://localhost:8080/sms-webhook'
      send_resolved: true

  # 数据库团队接收器
  - name: 'database-team'
    email_configs:
    - to: 'dba@example.com'
      subject: '[DB-ALERT] {{ .GroupLabels.alertname }}'

  # 网络团队接收器
  - name: 'network-team'
    email_configs:
    - to: 'network@example.com'
      subject: '[NET-ALERT] {{ .GroupLabels.alertname }}'
EOF

# 设置配置文件权限
chown alertmanager:alertmanager /etc/alertmanager/alertmanager.yml
chmod 640 /etc/alertmanager/alertmanager.yml
创建告警模板#
# 创建模板目录
mkdir -p /etc/alertmanager/templates

# 创建邮件模板
cat > /etc/alertmanager/templates/email.tmpl << 'EOF'
{{ define "email.default.subject" }}
[{{ .Status | toUpper }}{{ if eq .Status "firing" }}:{{ .Alerts.Firing | len }}{{ end }}] {{ .GroupLabels.SortedPairs.Values | join " " }}
{{ end }}

{{ define "email.default.html" }}
<!DOCTYPE html>
<html>
<head>
    <meta charset="UTF-8">
    <title>Prometheus Alert</title>
    <style>
        body { font-family: Arial, sans-serif; }
        .alert { margin: 10px 0; padding: 10px; border-left: 4px solid; }
        .firing { border-color: #d32f2f; background-color: #ffebee; }
        .resolved { border-color: #388e3c; background-color: #e8f5e8; }
        .label { font-weight: bold; }
    </style>
</head>
<body>
    <h2>Prometheus 告警通知</h2>

    {{ if gt (len .Alerts.Firing) 0 }}
    <h3>🔥 触发的告警 ({{ .Alerts.Firing | len }})</h3>
    {{ range .Alerts.Firing }}
    <div class="alert firing">
        <p><span class="label">告警名称:</span> {{ .Annotations.summary }}</p>
        <p><span class="label">告警详情:</span> {{ .Annotations.description }}</p>
        <p><span class="label">告警时间:</span> {{ .StartsAt.Format "2006-01-02 15:04:05" }}</p>
        <p><span class="label">告警标签:</span>
        {{ range .Labels.SortedPairs }}{{ .Name }}={{ .Value }} {{ end }}</p>
    </div>
    {{ end }}
    {{ end }}

    {{ if gt (len .Alerts.Resolved) 0 }}
    <h3>✅ 已解决的告警 ({{ .Alerts.Resolved | len }})</h3>
    {{ range .Alerts.Resolved }}
    <div class="alert resolved">
        <p><span class="label">告警名称:</span> {{ .Annotations.summary }}</p>
        <p><span class="label">解决时间:</span> {{ .EndsAt.Format "2006-01-02 15:04:05" }}</p>
        <p><span class="label">持续时间:</span> {{ .EndsAt.Sub .StartsAt }}</p>
    </div>
    {{ end }}
    {{ end }}
</body>
</html>
{{ end }}
EOF

# 设置模板权限
chown alertmanager:alertmanager /etc/alertmanager/templates/email.tmpl
第三步:配置防火墙#
# 开放 AlertManager 端口
firewall-cmd --permanent --add-port=9093/tcp
firewall-cmd --reload

# 验证防火墙规则
firewall-cmd --list-ports
第四步:创建系统服务#
cat > /etc/systemd/system/alertmanager.service << 'EOF'
[Unit]
Description=AlertManager
Documentation=https://prometheus.io/docs/alerting/alertmanager/
After=network-online.target
Wants=network-online.target

[Service]
Type=simple
User=alertmanager
Group=alertmanager
ExecReload=/bin/kill -HUP $MAINPID
ExecStart=/usr/local/bin/alertmanager \
  --config.file=/etc/alertmanager/alertmanager.yml \
  --storage.path=/var/lib/alertmanager \
  --web.external-url=http://localhost:9093 \
  --web.listen-address=0.0.0.0:9093 \
  --cluster.listen-address=0.0.0.0:9094 \
  --log.level=info \
  --log.format=logfmt

SyslogIdentifier=alertmanager
Restart=always
RestartSec=5
LimitNOFILE=65536

[Install]
WantedBy=multi-user.target
EOF

# 启动服务
systemctl daemon-reload
systemctl start alertmanager
systemctl enable alertmanager

# 检查服务状态
systemctl status alertmanager
第五步:配置 Prometheus 连接 AlertManager#
更新 Prometheus 配置文件:
# 编辑 Prometheus 配置
vim /etc/prometheus/prometheus.yml

# 在 alerting 部分添加 AlertManager 配置
alerting:
  alertmanagers:
    - static_configs:
        - targets:
          - localhost:9093
      timeout: 10s
      api_version: v2
# 重新加载 Prometheus 配置
systemctl reload prometheus

# 验证连接
curl http://localhost:9090/api/v1/alertmanagers
钉钉告警集成#
钉钉是企业常用的即时通讯工具,通过集成钉钉机器人可以实现实时告警通知。
第一步:创建钉钉机器人#
在钉钉群中添加机器人#
- 打开钉钉群聊
- 点击群设置 → 智能群助手 → 添加机器人
- 选择自定义机器人
- 配置机器人信息:
- 机器人名称:Prometheus 告警
- 安全设置:选择"加签"方式

图:在钉钉群中创建自定义机器人
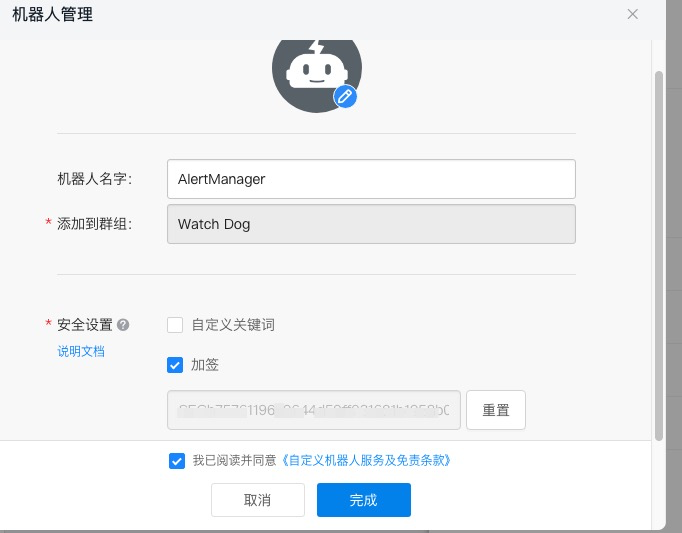
图:选择加签验证方式提高安全性
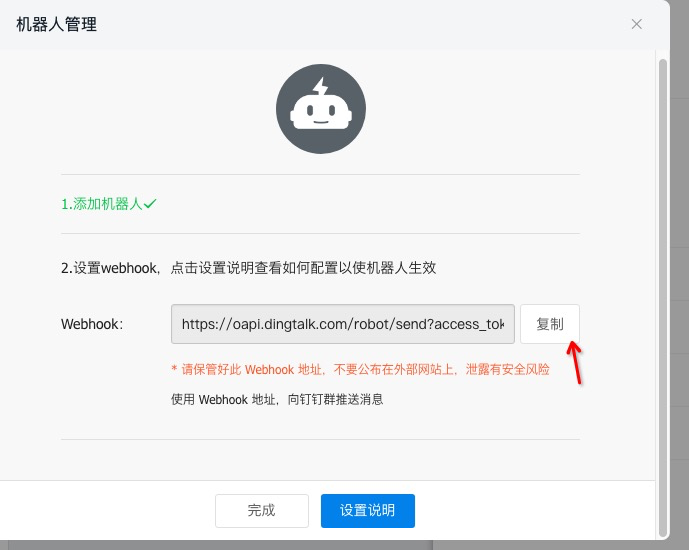
图:获取机器人的 Webhook 地址和密钥
记录重要信息#
创建完成后,请记录以下信息:
- Webhook URL:
https://oapi.dingtalk.com/robot/send?access_token=xxx - 加签密钥: 用于验证消息来源的密钥
第二步:安装钉钉 Webhook#
下载和安装#
# 下载钉钉 webhook
cd /tmp
wget https://github.com/timonwong/prometheus-webhook-dingtalk/releases/download/v2.1.0/prometheus-webhook-dingtalk-2.1.0.linux-amd64.tar.gz

# 解压安装
tar xf prometheus-webhook-dingtalk-2.1.0.linux-amd64.tar.gz

# 创建安装目录
mkdir -p /usr/local/webhook-dingtalk

# 复制文件
cp prometheus-webhook-dingtalk-2.1.0.linux-amd64/prometheus-webhook-dingtalk /usr/local/bin/
cp prometheus-webhook-dingtalk-2.1.0.linux-amd64/config.example.yml /etc/webhook-dingtalk/config.yml

# 设置执行权限
chmod +x /usr/local/bin/prometheus-webhook-dingtalk
创建配置目录#
# 创建配置目录
mkdir -p /etc/webhook-dingtalk

# 创建专用用户
useradd --no-create-home --shell /bin/false webhook-dingtalk
第三步:配置钉钉 Webhook#
创建配置文件#
cat > /etc/webhook-dingtalk/config.yml << 'EOF'
## Request timeout
timeout: 5s

## Customizable templates path
templates:
  - contrib/templates/legacy/template.tmpl

## You can also override default template using `default_message`
## The following example to use the 'legacy' template from v0.3.0
default_message:
  title: '{{ template "legacy.title" . }}'
  text: '{{ template "legacy.content" . }}'

## Targets, previously was known as "profiles"
targets:
  webhook1:
    url: https://oapi.dingtalk.com/robot/send?access_token=YOUR_ACCESS_TOKEN
    # 如果使用加签方式,需要配置 secret
    secret: YOUR_SECRET_KEY
    message:
      # 使用 markdown 格式
      title: 'Prometheus 告警通知'
      text: |
        ## {{ if eq .Status "firing" }}🔥 告警触发{{ else }}✅ 告警恢复{{ end }}

        **告警数量**: {{ len .Alerts }}

        {{ range .Alerts }}
        ### {{ .Annotations.summary }}

        **告警详情**: {{ .Annotations.description }}

        **告警时间**: {{ .StartsAt.Format "2006-01-02 15:04:05" }}

        **告警级别**: {{ .Labels.severity }}

        **影响实例**: {{ .Labels.instance }}

        **告警标签**: {{ range .Labels.SortedPairs }}{{ .Name }}={{ .Value }} {{ end }}

        ---
        {{ end }}

  webhook2:
    url: https://oapi.dingtalk.com/robot/send?access_token=ANOTHER_ACCESS_TOKEN
    secret: ANOTHER_SECRET_KEY
    message:
      title: '生产环境告警'
      text: '{{ template "legacy.content" . }}'
EOF

# 替换配置中的占位符
# 请将 YOUR_ACCESS_TOKEN 和 YOUR_SECRET_KEY 替换为实际值
sed -i 's/YOUR_ACCESS_TOKEN/your-actual-access-token/g' /etc/webhook-dingtalk/config.yml
sed -i 's/YOUR_SECRET_KEY/your-actual-secret-key/g' /etc/webhook-dingtalk/config.yml

# 设置配置文件权限
chown webhook-dingtalk:webhook-dingtalk /etc/webhook-dingtalk/config.yml
chmod 640 /etc/webhook-dingtalk/config.yml
第四步:创建系统服务#
cat > /etc/systemd/system/webhook-dingtalk.service << 'EOF'
[Unit]
Description=Prometheus Webhook for DingTalk
Documentation=https://github.com/timonwong/prometheus-webhook-dingtalk
After=network-online.target
Wants=network-online.target

[Service]
Type=simple
User=webhook-dingtalk
Group=webhook-dingtalk
ExecStart=/usr/local/bin/prometheus-webhook-dingtalk \
  --web.listen-address=127.0.0.1:8060 \
  --web.enable-ui \
  --config.file=/etc/webhook-dingtalk/config.yml \
  --log.level=info \
  --log.format=logfmt

SyslogIdentifier=webhook-dingtalk
Restart=always
RestartSec=5
LimitNOFILE=65536

[Install]
WantedBy=multi-user.target
EOF

# 启动服务
systemctl daemon-reload
systemctl start webhook-dingtalk
systemctl enable webhook-dingtalk

# 检查服务状态
systemctl status webhook-dingtalk
第五步:测试钉钉通知#
测试 Webhook 连通性#
# 测试钉钉 webhook 是否正常工作
curl -X POST http://localhost:8060/dingtalk/webhook1/send \
  -H 'Content-Type: application/json' \
  -d '{
    "msgtype": "text",
    "text": {
      "content": "Prometheus 钉钉告警测试消息"
    }
  }'
测试告警格式#
# 模拟 AlertManager 发送的告警格式
curl -X POST http://localhost:8060/dingtalk/webhook1/send \
  -H 'Content-Type: application/json' \
  -d '{
    "receiver": "webhook1",
    "status": "firing",
    "alerts": [
      {
        "status": "firing",
        "labels": {
          "alertname": "HighCPUUsage",
          "instance": "localhost:9100",
          "severity": "warning"
        },
        "annotations": {
          "summary": "CPU 使用率过高",
          "description": "CPU 使用率超过 80%"
        },
        "startsAt": "2023-01-01T12:00:00Z"
      }
    ]
  }'

图:钉钉机器人成功发送测试消息
第六步:配置 AlertManager 集成钉钉#
更新 AlertManager 配置#
cat > /etc/alertmanager/alertmanager.yml << 'EOF'
global:
  resolve_timeout: 5m

# 路由配置
route:
  receiver: 'dingtalk-webhook'
  group_by: ['alertname', 'cluster', 'service']
  group_wait: 10s
  group_interval: 10s
  repeat_interval: 1h

  routes:
  # 严重告警立即发送到钉钉
  - match:
      severity: critical
    receiver: 'dingtalk-critical'
    group_wait: 0s
    repeat_interval: 5m

  # 普通告警发送到钉钉
  - match:
      severity: warning
    receiver: 'dingtalk-warning'

# 接收器配置
receivers:
  # 默认钉钉接收器
  - name: 'dingtalk-webhook'
    webhook_configs:
    - url: 'http://127.0.0.1:8060/dingtalk/webhook1/send'
      send_resolved: true
      http_config:
        timeout: 10s

  # 严重告警钉钉接收器
  - name: 'dingtalk-critical'
    webhook_configs:
    - url: 'http://127.0.0.1:8060/dingtalk/webhook1/send'
      send_resolved: true
      title: '🚨 严重告警 🚨'

  # 警告级别钉钉接收器
  - name: 'dingtalk-warning'
    webhook_configs:
    - url: 'http://127.0.0.1:8060/dingtalk/webhook1/send'
      send_resolved: true
      title: '⚠️ 警告告警 ⚠️'

# 抑制规则
inhibit_rules:
  - source_match:
      alertname: 'InstanceDown'
    target_match_re:
      alertname: '^(HighCPUUsage|HighMemoryUsage)$'
    equal: ['instance']
EOF

# 重新加载 AlertManager 配置
systemctl reload alertmanager

# 验证配置
curl http://localhost:9093/api/v1/status
Node Exporter 系统监控#
Node Exporter 是 Prometheus 官方提供的系统监控组件,用于收集 Linux 系统的各种指标。
第一步:安装 Node Exporter#
下载和安装#
# 下载 Node Exporter
cd /tmp
wget https://github.com/prometheus/node_exporter/releases/download/v1.3.1/node_exporter-1.3.1.linux-amd64.tar.gz

# 解压安装包
tar xf node_exporter-1.3.1.linux-amd64.tar.gz

# 复制二进制文件
cp node_exporter-1.3.1.linux-amd64/node_exporter /usr/local/bin/

# 设置执行权限
chmod +x /usr/local/bin/node_exporter

# 验证安装
node_exporter --version
创建用户和目录#
# 创建 node_exporter 用户
useradd --no-create-home --shell /bin/false node_exporter

# 创建文本收集器目录
mkdir -p /var/lib/node_exporter/textfile_collector

# 设置目录权限
chown -R node_exporter:node_exporter /var/lib/node_exporter
第二步:配置 Node Exporter#
创建系统服务#
cat > /etc/systemd/system/node_exporter.service << 'EOF'
[Unit]
Description=Node Exporter
Documentation=https://prometheus.io/docs/guides/node-exporter/
After=network-online.target
Wants=network-online.target

[Service]
Type=simple
User=node_exporter
Group=node_exporter
ExecStart=/usr/local/bin/node_exporter \
  --web.listen-address=0.0.0.0:9100 \
  --path.procfs=/proc \
  --path.sysfs=/sys \
  --collector.filesystem.ignored-mount-points="^/(sys|proc|dev|host|etc|rootfs/var/lib/docker/containers|rootfs/var/lib/docker/overlay2|rootfs/run/docker/netns|rootfs/var/lib/docker/aufs)($$|/)" \
  --collector.filesystem.ignored-fs-types="^(autofs|binfmt_misc|bpf|cgroup2?|configfs|debugfs|devpts|devtmpfs|fusectl|hugetlbfs|mqueue|nsfs|overlay|proc|procfs|pstore|rpc_pipefs|securityfs|selinuxfs|squashfs|sysfs|tracefs)$$" \
  --collector.textfile.directory=/var/lib/node_exporter/textfile_collector \
  --collector.systemd \
  --collector.systemd.unit-whitelist="(sshd|docker|nginx|mysql|redis|postgresql)\\.service" \
  --collector.processes \
  --collector.tcpstat \
  --no-collector.mdadm

SyslogIdentifier=node_exporter
Restart=always
RestartSec=5
LimitNOFILE=65536

[Install]
WantedBy=multi-user.target
EOF
启动参数说明:
--collector.filesystem.ignored-mount-points: 忽略的挂载点--collector.filesystem.ignored-fs-types: 忽略的文件系统类型--collector.textfile.directory: 文本收集器目录--collector.systemd: 启用 systemd 收集器--collector.systemd.unit-whitelist: 监控的服务白名单
启动服务#
# 启动 Node Exporter
systemctl daemon-reload
systemctl start node_exporter
systemctl enable node_exporter

# 检查服务状态
systemctl status node_exporter

# 验证指标收集
curl http://localhost:9100/metrics | head -20
第三步:配置自定义指标收集#
创建自定义指标文件#
# 创建系统元数据指标
cat > /var/lib/node_exporter/textfile_collector/metadata.prom << 'EOF'
# HELP node_metadata_info System metadata information
# TYPE node_metadata_info gauge
node_metadata_info{role="web-server",datacenter="dc1",environment="production"} 1
EOF

# 创建应用状态监控脚本
cat > /usr/local/bin/app_status_check.sh << 'EOF'
#!/bin/bash
# 应用状态检查脚本

TEXTFILE_DIR="/var/lib/node_exporter/textfile_collector"
TEMP_FILE="${TEXTFILE_DIR}/app_status.prom.$$"
PROM_FILE="${TEXTFILE_DIR}/app_status.prom"

# 检查 Nginx 状态
if systemctl is-active --quiet nginx; then
    nginx_status=1
else
    nginx_status=0
fi

# 检查 Docker 状态
if systemctl is-active --quiet docker; then
    docker_status=1
else
    docker_status=0
fi

# 检查磁盘空间
root_usage=$(df / | awk 'NR==2 {print $5}' | sed 's/%//')

# 生成指标文件
cat > "$TEMP_FILE" << EOL
# HELP app_service_status Application service status (1=running, 0=stopped)
# TYPE app_service_status gauge
app_service_status{service="nginx"} $nginx_status
app_service_status{service="docker"} $docker_status

# HELP system_disk_usage_percent Disk usage percentage
# TYPE system_disk_usage_percent gauge
system_disk_usage_percent{mountpoint="/"} $root_usage
EOL

# 原子性更新指标文件
mv "$TEMP_FILE" "$PROM_FILE"
EOF

# 设置脚本权限
chmod +x /usr/local/bin/app_status_check.sh
chown node_exporter:node_exporter /usr/local/bin/app_status_check.sh

# 设置定时任务
echo "*/1 * * * * node_exporter /usr/local/bin/app_status_check.sh" | crontab -u node_exporter -
第四步:常用查询示例#
系统监控查询#
# 查看 Node Exporter 收集的指标
curl -s http://localhost:9100/metrics | grep -E "^node_" | head -10

# 在 Prometheus 中查询系统指标的示例:
CPU 使用率查询:
# 5分钟平均 CPU 使用率
100 - (avg by(instance) (irate(node_cpu_seconds_total{mode="idle"}[5m])) * 100)

# 各个 CPU 核心使用率
100 - (avg by(instance, cpu) (irate(node_cpu_seconds_total{mode="idle"}[5m])) * 100)
内存使用率查询:
# 内存使用率
(1 - (node_memory_MemAvailable_bytes / node_memory_MemTotal_bytes)) * 100

# 可用内存
node_memory_MemAvailable_bytes / 1024 / 1024 / 1024
磁盘使用率查询:
# 根分区磁盘使用率
(1 - (node_filesystem_avail_bytes{mountpoint="/"} / node_filesystem_size_bytes{mountpoint="/"})) * 100

# 所有分区磁盘使用率
(1 - (node_filesystem_avail_bytes{fstype!="tmpfs"} / node_filesystem_size_bytes{fstype!="tmpfs"})) * 100
网络流量查询:
# 网络接收速率 (bytes/sec)
rate(node_network_receive_bytes_total[5m])

# 网络发送速率 (bytes/sec)
rate(node_network_transmit_bytes_total[5m])
系统服务状态查询:
# Docker 服务状态
node_systemd_unit_state{name="docker.service",state="active"}

# SSH 服务状态
node_systemd_unit_state{name="sshd.service",state="active"}

# 所有活跃服务
node_systemd_unit_state{state="active"} == 1
第五步:配置 Prometheus 抓取 Node Exporter#
更新 Prometheus 配置文件:
# 编辑 Prometheus 配置
vim /etc/prometheus/prometheus.yml
添加 Node Exporter 抓取配置:
scrape_configs:
  - job_name: 'node-exporter'
    static_configs:
      - targets: ['localhost:9100']
        labels:
          instance: 'prometheus-server'
          environment: 'production'
    scrape_interval: 30s
    scrape_timeout: 10s
    metrics_path: /metrics

    # 指标重新标记配置
    metric_relabel_configs:
      # 删除不需要的指标
      - source_labels: [__name__]
        regex: 'node_scrape_collector_.*'
        action: drop
      # 重命名实例标签
      - source_labels: [instance]
        target_label: node_instance
# 重新加载 Prometheus 配置
systemctl reload prometheus

# 验证目标状态
curl http://localhost:9090/api/v1/targets
常用 PromQL 查询公式#
PromQL(Prometheus Query Language)是 Prometheus 的查询语言,以下是一些常用的监控查询公式。
配置文件验证#
# 检查 Prometheus 配置文件语法
promtool check config /etc/prometheus/prometheus.yml

# 检查规则文件语法
promtool check rules /etc/prometheus/rules/*.yml

# 查询配置文件中的目标
promtool query instant 'up'
系统资源监控公式#
CPU 使用率#
# 5分钟平均 CPU 使用率
100 - (avg by(instance) (irate(node_cpu_seconds_total{mode="idle"}[5m])) * 100)

# 各个 CPU 核心使用率
100 - (avg by(instance, cpu) (irate(node_cpu_seconds_total{mode="idle"}[5m])) * 100)

# CPU 负载
node_load1  # 1分钟负载
node_load5  # 5分钟负载
node_load15 # 15分钟负载

# CPU 负载率(负载/CPU核数)
node_load1 / count by(instance) (node_cpu_seconds_total{mode="idle"})
内存使用率#
# 内存使用率(推荐公式)
(1 - (node_memory_MemAvailable_bytes / node_memory_MemTotal_bytes)) * 100

# 内存使用率(传统公式)
((node_memory_MemTotal_bytes - node_memory_MemFree_bytes - node_memory_Cached_bytes - node_memory_Buffers_bytes) / node_memory_MemTotal_bytes) * 100

# 可用内存(GB)
node_memory_MemAvailable_bytes / 1024 / 1024 / 1024

# 内存使用量(GB)
(node_memory_MemTotal_bytes - node_memory_MemAvailable_bytes) / 1024 / 1024 / 1024
磁盘使用率#
# 根分区磁盘使用率
(1 - (node_filesystem_avail_bytes{mountpoint="/"} / node_filesystem_size_bytes{mountpoint="/"})) * 100

# 所有分区磁盘使用率(排除临时文件系统)
(1 - (node_filesystem_avail_bytes{fstype!="tmpfs"} / node_filesystem_size_bytes{fstype!="tmpfs"})) * 100

# 磁盘可用空间(GB)
node_filesystem_avail_bytes{mountpoint="/"} / 1024 / 1024 / 1024

# 磁盘 I/O 使用率
rate(node_disk_io_time_seconds_total[5m]) * 100
网络流量#
# 网络接收速率(MB/s)
rate(node_network_receive_bytes_total[5m]) / 1024 / 1024

# 网络发送速率(MB/s)
rate(node_network_transmit_bytes_total[5m]) / 1024 / 1024

# 网络错误率
rate(node_network_receive_errs_total[5m])
rate(node_network_transmit_errs_total[5m])

# 网络丢包率
rate(node_network_receive_drop_total[5m])
rate(node_network_transmit_drop_total[5m])
应用监控公式#
HTTP 请求监控#
# 请求速率(QPS)
rate(http_requests_total[5m])

# 按状态码分组的请求速率
sum by(code) (rate(http_requests_total[5m]))

# 错误率
rate(http_requests_total{code=~"5.."}[5m]) / rate(http_requests_total[5m]) * 100

# 平均响应时间
rate(http_request_duration_seconds_sum[5m]) / rate(http_request_duration_seconds_count[5m])

# 95% 响应时间
histogram_quantile(0.95, rate(http_request_duration_seconds_bucket[5m]))
数据库监控#
# MySQL 连接数
mysql_global_status_threads_connected

# MySQL QPS
rate(mysql_global_status_queries[5m])

# MySQL 慢查询
rate(mysql_global_status_slow_queries[5m])

# Redis 内存使用
redis_memory_used_bytes

# Redis 连接数
redis_connected_clients
记录规则(Recording Rules)#
记录规则允许您预先计算经常需要或计算开销昂贵的表达式,并将其结果保存为新的时间序列。
创建记录规则#
# 创建记录规则目录
mkdir -p /etc/prometheus/rules

# 创建记录规则文件
cat > /etc/prometheus/rules/recording_rules.yml << 'EOF'
groups:
  - name: node_recording_rules
    interval: 30s
    rules:
    # CPU 使用率记录规则
    - record: instance:node_cpu_utilization:rate5m
      expr: 100 - (avg by(instance) (irate(node_cpu_seconds_total{mode="idle"}[5m])) * 100)
      labels:
        metric_type: utilization

    # 内存使用率记录规则
    - record: instance:node_memory_utilization:ratio
      expr: (1 - (node_memory_MemAvailable_bytes / node_memory_MemTotal_bytes)) * 100
      labels:
        metric_type: utilization

    # 磁盘使用率记录规则
    - record: instance:node_filesystem_utilization:ratio
      expr: (1 - (node_filesystem_avail_bytes{fstype!="tmpfs"} / node_filesystem_size_bytes{fstype!="tmpfs"})) * 100
      labels:
        metric_type: utilization

    # 网络流量记录规则
    - record: instance:node_network_receive_bytes:rate5m
      expr: rate(node_network_receive_bytes_total[5m])
      labels:
        metric_type: traffic
        direction: receive

    - record: instance:node_network_transmit_bytes:rate5m
      expr: rate(node_network_transmit_bytes_total[5m])
      labels:
        metric_type: traffic
        direction: transmit

  - name: application_recording_rules
    interval: 30s
    rules:
    # HTTP 请求速率
    - record: job:http_requests:rate5m
      expr: sum by(job) (rate(http_requests_total[5m]))

    # HTTP 错误率
    - record: job:http_requests_error_rate:rate5m
      expr: sum by(job) (rate(http_requests_total{code=~"5.."}[5m])) / sum by(job) (rate(http_requests_total[5m]))

    # 平均响应时间
    - record: job:http_request_duration:mean5m
      expr: sum by(job) (rate(http_request_duration_seconds_sum[5m])) / sum by(job) (rate(http_request_duration_seconds_count[5m]))
EOF

# 验证规则文件
promtool check rules /etc/prometheus/rules/recording_rules.yml

# 更新 Prometheus 配置文件
cat >> /etc/prometheus/prometheus.yml << 'EOF'

rule_files:
  - "rules/*.yml"
EOF

# 重新加载配置
systemctl reload prometheus
使用记录规则#
# 使用预计算的 CPU 使用率
instance:node_cpu_utilization:rate5m

# 使用预计算的内存使用率
instance:node_memory_utilization:ratio

# 使用预计算的网络流量
instance:node_network_receive_bytes:rate5m
instance:node_network_transmit_bytes:rate5m
服务发现配置#
Prometheus 支持多种服务发现机制,可以自动发现和监控动态变化的目标。
基于文件的服务发现#
文件服务发现是最简单和常用的服务发现方式,适合静态或半静态的环境。
创建目标文件目录#
# 创建服务发现目录结构
cd /etc/prometheus
mkdir -p targets/{linux_nodes,docker_nodes,windows_nodes,databases,applications}

# 设置目录权限
chown -R prometheus:prometheus targets/
配置 Prometheus 使用文件服务发现#
# 在 prometheus.yml 中配置文件服务发现
scrape_configs:
  # Linux 节点监控
  - job_name: 'linux-nodes'
    file_sd_configs:
      - files:
          - 'targets/linux_nodes/*.json'
        refresh_interval: 30s
    scrape_interval: 30s
    metrics_path: /metrics

  # Docker 容器监控
  - job_name: 'docker-containers'
    file_sd_configs:
      - files:
          - 'targets/docker_nodes/*.json'
        refresh_interval: 30s
    scrape_interval: 30s

  # Windows 节点监控
  - job_name: 'windows-nodes'
    file_sd_configs:
      - files:
          - 'targets/windows_nodes/*.json'
        refresh_interval: 30s
    scrape_interval: 30s

  # 数据库监控
  - job_name: 'databases'
    file_sd_configs:
      - files:
          - 'targets/databases/*.json'
        refresh_interval: 30s
    scrape_interval: 30s

  # 应用程序监控
  - job_name: 'applications'
    file_sd_configs:
      - files:
          - 'targets/applications/*.json'
        refresh_interval: 30s
    scrape_interval: 30s
创建目标配置文件#
Linux 节点配置:
cat > /etc/prometheus/targets/linux_nodes/production.json << 'EOF'
[
  {
    "targets": [
      "web-server-01:9100",
      "web-server-02:9100",
      "db-server-01:9100"
    ],
    "labels": {
      "environment": "production",
      "datacenter": "dc1",
      "team": "infrastructure"
    }
  },
  {
    "targets": [
      "app-server-01:9100",
      "app-server-02:9100"
    ],
    "labels": {
      "environment": "production",
      "datacenter": "dc1",
      "team": "application",
      "service": "web-app"
    }
  }
]
EOF
数据库监控配置:
cat > /etc/prometheus/targets/databases/mysql.json << 'EOF'
[
  {
    "targets": [
      "mysql-master:9104",
      "mysql-slave-01:9104",
      "mysql-slave-02:9104"
    ],
    "labels": {
      "environment": "production",
      "database_type": "mysql",
      "cluster": "main"
    }
  }
]
EOF

cat > /etc/prometheus/targets/databases/redis.json << 'EOF'
[
  {
    "targets": [
      "redis-01:9121",
      "redis-02:9121",
      "redis-03:9121"
    ],
    "labels": {
      "environment": "production",
      "database_type": "redis",
      "cluster": "cache"
    }
  }
]
EOF
应用程序监控配置:
cat > /etc/prometheus/targets/applications/web-services.json << 'EOF'
[
  {
    "targets": [
      "api-gateway:8080",
      "user-service:8081",
      "order-service:8082"
    ],
    "labels": {
      "environment": "production",
      "service_type": "microservice",
      "team": "backend"
    }
  }
]
EOF
基于 Kubernetes 的服务发现#
对于 Kubernetes 环境,可以使用内置的服务发现机制:
scrape_configs:
  # Kubernetes Pod 发现
  - job_name: 'kubernetes-pods'
    kubernetes_sd_configs:
      - role: pod
    relabel_configs:
      - source_labels: [__meta_kubernetes_pod_annotation_prometheus_io_scrape]
        action: keep
        regex: true
      - source_labels: [__meta_kubernetes_pod_annotation_prometheus_io_path]
        action: replace
        target_label: __metrics_path__
        regex: (.+)
      - source_labels: [__address__, __meta_kubernetes_pod_annotation_prometheus_io_port]
        action: replace
        regex: ([^:]+)(?::\d+)?;(\d+)
        replacement: $1:$2
        target_label: __address__

  # Kubernetes Service 发现
  - job_name: 'kubernetes-services'
    kubernetes_sd_configs:
      - role: service
    relabel_configs:
      - source_labels: [__meta_kubernetes_service_annotation_prometheus_io_scrape]
        action: keep
        regex: true
动态目标管理脚本#
创建脚本来动态管理监控目标:
cat > /usr/local/bin/prometheus-target-manager.sh << 'EOF'
#!/bin/bash
# Prometheus 目标管理脚本

TARGETS_DIR="/etc/prometheus/targets"
BACKUP_DIR="/var/backups/prometheus-targets"

# 创建备份目录
mkdir -p "$BACKUP_DIR"

# 备份当前配置
backup_targets() {
    local timestamp=$(date +%Y%m%d_%H%M%S)
    tar -czf "$BACKUP_DIR/targets_backup_$timestamp.tar.gz" -C "$TARGETS_DIR" .
    echo "目标配置已备份到: $BACKUP_DIR/targets_backup_$timestamp.tar.gz"
}

# 添加新目标
add_target() {
    local category="$1"
    local target="$2"
    local labels="$3"
    local file="$TARGETS_DIR/$category/dynamic.json"

    # 创建目录
    mkdir -p "$TARGETS_DIR/$category"

    # 如果文件不存在,创建空数组
    if [[ ! -f "$file" ]]; then
        echo '[]' > "$file"
    fi

    # 添加目标(这里简化处理,实际应该使用 jq 工具)
    echo "目标 $target 已添加到 $category"
}

# 删除目标
remove_target() {
    local category="$1"
    local target="$2"
    local file="$TARGETS_DIR/$category/dynamic.json"

    if [[ -f "$file" ]]; then
        # 使用 jq 删除目标
        echo "目标 $target 已从 $category 中删除"
    fi
}

# 验证配置
validate_config() {
    promtool check config /etc/prometheus/prometheus.yml
}

# 重新加载 Prometheus
reload_prometheus() {
    if systemctl is-active --quiet prometheus; then
        systemctl reload prometheus
        echo "Prometheus 配置已重新加载"
    else
        echo "错误: Prometheus 服务未运行"
        return 1
    fi
}

# 主函数
case "$1" in
    backup)
        backup_targets
        ;;
    add)
        add_target "$2" "$3" "$4"
        ;;
    remove)
        remove_target "$2" "$3"
        ;;
    validate)
        validate_config
        ;;
    reload)
        reload_prometheus
        ;;
    *)
        echo "用法: $0 {backup|add|remove|validate|reload}"
        echo "  backup                     - 备份当前目标配置"
        echo "  add <category> <target>    - 添加新目标"
        echo "  remove <category> <target> - 删除目标"
        echo "  validate                   - 验证配置文件"
        echo "  reload                     - 重新加载 Prometheus"
        exit 1
        ;;
esac
EOF

chmod +x /usr/local/bin/prometheus-target-manager.sh
性能优化和最佳实践#
性能调优#
Prometheus 服务器优化#
# 优化 Prometheus 启动参数
cat > /etc/systemd/system/prometheus.service << 'EOF'
[Unit]
Description=Prometheus Server
Documentation=https://prometheus.io/docs/
After=network-online.target
Wants=network-online.target

[Service]
Type=simple
User=prometheus
Group=prometheus
ExecStart=/usr/local/bin/prometheus \
  --config.file=/etc/prometheus/prometheus.yml \
  --storage.tsdb.path=/var/lib/prometheus \
  --storage.tsdb.retention.time=30d \
  --storage.tsdb.retention.size=50GB \
  --storage.tsdb.wal-compression \
  --web.console.templates=/etc/prometheus/consoles \
  --web.console.libraries=/etc/prometheus/console_libraries \
  --web.listen-address=0.0.0.0:9090 \
  --web.external-url=http://localhost:9090 \
  --web.enable-lifecycle \
  --web.enable-admin-api \
  --web.max-connections=512 \
  --query.max-concurrency=20 \
  --query.timeout=2m \
  --log.level=info

Restart=always
RestartSec=5
LimitNOFILE=65536

[Install]
WantedBy=multi-user.target
EOF
存储优化#
# 创建存储优化脚本
cat > /usr/local/bin/prometheus-storage-optimize.sh << 'EOF'
#!/bin/bash
# Prometheus 存储优化脚本

PROMETHEUS_DATA="/var/lib/prometheus"
LOG_FILE="/var/log/prometheus-optimize.log"

log() {
    echo "[$(date '+%Y-%m-%d %H:%M:%S')] $1" | tee -a "$LOG_FILE"
}

# 检查磁盘使用情况
check_disk_usage() {
    local usage=$(df "$PROMETHEUS_DATA" | awk 'NR==2 {print $5}' | sed 's/%//')
    log "当前磁盘使用率: ${usage}%"

    if [[ $usage -gt 80 ]]; then
        log "警告: 磁盘使用率超过 80%"
        return 1
    fi
    return 0
}

# 清理过期数据
cleanup_old_data() {
    log "开始清理过期数据..."

    # 使用 Prometheus API 删除过期数据
    curl -X POST http://localhost:9090/api/v1/admin/tsdb/delete_series?match[]={__name__=~".+"}&start=0&end=$(date -d '30 days ago' +%s)

    # 清理墓碑数据
    curl -X POST http://localhost:9090/api/v1/admin/tsdb/clean_tombstones

    log "数据清理完成"
}

# 压缩数据
compact_data() {
    log "开始数据压缩..."

    # 停止 Prometheus
    systemctl stop prometheus

    # 运行压缩
    /usr/local/bin/promtool tsdb create-blocks-from openmetrics "$PROMETHEUS_DATA"

    # 重启 Prometheus
    systemctl start prometheus

    log "数据压缩完成"
}

# 主函数
main() {
    log "开始 Prometheus 存储优化"

    if ! check_disk_usage; then
        cleanup_old_data
        sleep 60
        compact_data
    fi

    log "存储优化完成"
}

main "$@"
EOF

chmod +x /usr/local/bin/prometheus-storage-optimize.sh

# 设置定时任务
echo "0 2 * * 0 /usr/local/bin/prometheus-storage-optimize.sh" | crontab -
监控和告警最佳实践#
1. 告警规则设计原则#
- 可操作性: 每个告警都应该有明确的处理步骤
- 避免噪音: 设置合理的阈值和持续时间
- 分级处理: 根据严重程度设置不同的通知方式
2. 标签规范#
# 推荐的标签规范
global:
  external_labels:
    cluster: 'production'
    region: 'us-west-1'
    datacenter: 'dc1'

# 在抓取配置中添加标准标签
scrape_configs:
  - job_name: 'web-servers'
    static_configs:
      - targets: ['web-01:9100', 'web-02:9100']
        labels:
          environment: 'production'
          service: 'web'
          team: 'frontend'
          tier: 'web'
3. 查询优化#
# 好的查询示例
rate(http_requests_total[5m])

# 避免的查询示例(时间范围太长)
rate(http_requests_total[1h])

# 使用记录规则预计算复杂查询
instance:node_cpu_utilization:rate5m
安全配置#
1. 网络安全#
# 配置防火墙
firewall-cmd --permanent --add-rich-rule='rule family="ipv4" source address="10.0.0.0/8" port protocol="tcp" port="9090" accept'
firewall-cmd --reload

# 使用 TLS 加密
# 在 Nginx 配置中启用 HTTPS
2. 认证和授权#
# 在 prometheus.yml 中配置基本认证
basic_auth_users:
  admin: $2b$12$hNf2lSsxfm0.i4a.1kVpSOVyBCfIB51VRjgBUyv6kdnyTlgWj81Ay
备份和恢复#
备份策略#
cat > /usr/local/bin/prometheus-backup.sh << 'EOF'
#!/bin/bash
# Prometheus 备份脚本

PROMETHEUS_DATA="/var/lib/prometheus"
BACKUP_DIR="/backup/prometheus"
RETENTION_DAYS=30

# 创建备份目录
mkdir -p "$BACKUP_DIR"

# 创建快照
SNAPSHOT_NAME="prometheus-$(date +%Y%m%d-%H%M%S)"
curl -X POST http://localhost:9090/api/v1/admin/tsdb/snapshot

# 获取快照目录
SNAPSHOT_DIR=$(ls -t "$PROMETHEUS_DATA/snapshots" | head -1)

# 压缩备份
tar -czf "$BACKUP_DIR/$SNAPSHOT_NAME.tar.gz" -C "$PROMETHEUS_DATA/snapshots" "$SNAPSHOT_DIR"

# 清理快照
rm -rf "$PROMETHEUS_DATA/snapshots/$SNAPSHOT_DIR"

# 清理过期备份
find "$BACKUP_DIR" -name "prometheus-*.tar.gz" -mtime +$RETENTION_DAYS -delete

echo "备份完成: $BACKUP_DIR/$SNAPSHOT_NAME.tar.gz"
EOF

chmod +x /usr/local/bin/prometheus-backup.sh

# 设置定时备份
echo "0 3 * * * /usr/local/bin/prometheus-backup.sh" | crontab -
总结与展望#
部署总结#
通过本文的详细指导,我们成功实现了:
✅ 完整的 Prometheus 监控系统: 从安装到配置的全流程部署 ✅ AlertManager 告警管理: 支持邮件、钉钉等多种通知方式 ✅ 多种 Exporter 集成: Node、MySQL、Redis、PHP-FPM 等监控组件 ✅ 高级功能配置: 记录规则、服务发现、性能优化等企业级特性 ✅ 运维管理工具: 备份、恢复、性能调优等运维脚本
监控体系架构#
flowchart LR
    subgraph Exporters[Exporters 数据源]
        E1[Node Exporter]
        E2[MySQL Exporter]
        E3[Redis Exporter]
        E4[Custom Exporter]
    end

    subgraph Prometheus[Prometheus]
        P1[Scraping]
        P2[Storage]
        P3[Query Engine]
    end

    subgraph AlertManager[AlertManager]
        A1[Alerting]
        A2[Routing]
        A3[Notification]
    end

    subgraph Visualization[可视化与通知]
        V1[Grafana]
        V2[钉钉/邮件]
    end

    E1 --> P1
    E2 --> P1
    E3 --> P1
    E4 --> P1

    P1 --> P2
    P1 --> P3

    P3 --> A1
    A1 --> A2
    A2 --> A3

    P3 --> V1
    A3 --> V2
最佳实践要点#
- 规划先行: 合理规划监控指标和告警策略
- 标准化: 统一标签规范和命名约定
- 自动化: 使用服务发现和自动化脚本
- 优化性能: 定期清理数据和优化查询
- 安全第一: 配置认证、授权和网络安全
扩展方向#
未来可以考虑以下扩展:
- 高可用部署: Prometheus 集群和联邦配置
- 长期存储: 集成 Thanos 或 VictoriaMetrics
- 服务网格监控: Istio、Linkerd 等服务网格集成
- 云原生监控: Kubernetes 原生监控解决方案
- AI 运维: 基于机器学习的异常检测和预测
通过本指南,您已经掌握了 Prometheus 监控系统的完整部署和管理技能,可以为企业构建一个稳定、高效、可扩展的监控平台。在实际使用过程中,请根据具体需求调整配置参数,并持续关注社区更新和最佳实践。
[root@localhost prometheus]# promtool check config prometheus.yml Checking prometheus.yml SUCCESS: 1 rule files found
Checking rules/node_alerts.yml SUCCESS: 3 rules found
/usr/sbin/lsof -n -P -t -i :9090 |xargs kill -HUP
// 也可以使用下面的这种方式(YAML)
cat /etc/prometheus/targets/nodes/demo.json#
- targets:
- “192.168.20.172:8080”
- “192.168.20.173:8080”
- “192.168.20.174:8080”
### alertmanager 设置钉钉告警    [参考链接](<https://www.cnblogs.com/pyuh/p/9548495.html>)

```shell
yum install go -y
mkdir -p /usr/lib/golang/src/github.com/timonwong/
git clone https://github.com/timonwong/prometheus-webhook-dingtalk.git
make
cp prometheus-webhook-dingtalk /usr/local/bin
nohup prometheus-webhook-dingtalk --web.listen-address=":8228" --ding.profile="webhook1=https://oapi.dingtalk.com/robot/send?access_token=d4d3069d3ef12a9487ecf878b7611579d8d100e0a82516cc8e80009cbb506ebc"   2>&1 1>/tmp/dingding.log &               #安装钉钉插件并启动
配置黑盒监控#
(下载地址)[https://github.com/prometheus/blackbox_exporter]
wget https://github.com/prometheus/blackbox_exporter/releases/download/v0.14.0/blackbox_exporter-0.14.0.linux-amd64.tar.gz
tar xf blackbox_exporter-0.14.0.linux-amd64.tar.gz
mkdir /etc/exporter && cp ./blackbox_exporter-0.14.0.linux-amd64/blackbox_exporter-0.14.0.linux-amd64 /usr/local/bin/
  cp ./blackbox_exporter-0.14.0.linux-amd64/blackbox.yml /etc/exporter/blackbox.yml
nohup blackbox_exporter --config.file="/etc/exporter/blackbox.yml" --web.listen-address=":9115" --log.level=info >/tmp/blackbox.log 2>&1 &  #启动
blackbox_exporter 添加至自启动#
 cat  > /usr/lib/systemd/system/blackbox_exporter.service <<EOF
[Unit]
Description=blackbox_exporter
Documentation=https://github.com/prometheus/blackbox_exporter
After=network.target

[Service]
Type=simple
User=root
ExecStart=/usr/local/bin/blackbox_exporter --config.file=/etc/exporter/blackbox.yml --web.listen-address=192.168.8.122:9115
Restart=on-failure

[Install]
WantedBy=multi-user.target
EOF

systemctl daemon-reload && systemctl start blackbox_exporter && systemctl status blackbox_exporter   #启动

systemctl enable blackbox_exporter  #加入开机自启动
lsof -i :9115
docker 启动
mkdir -p /application/black-box-exporter/config

wget -O /application/black-box-exporter/config/blackbox.yml https://raw.githubusercontent.com/prometheus/blackbox_exporter/master/blackbox.yml

docker run -d \
-p 9115:9115 --name blackbox_exporter \
--restart always \
--net=host \
-v /application/black-box-exporter/config:/config prom/blackbox-exporter:master \
--config.file=/config/blackbox.yml \
--web.external-url=/black-box
配置php-fpm_exporter#
[root@hadoopname ~]# egrep '/ping|/status' /usr/local/php/etc/php-fpm.d/walle.conf
pm.status_path = /status
ping.path = /ping    #


[root@hadoopname ~]# cat /usr/local/nginx/conf/conf.d/
cobra.conf       jumpserver.conf  official.conf    php_status.conf  walle.conf       zabbix.conf
[root@hadoopname ~]# cat /usr/local/nginx/conf/conf.d/php_status.conf
server {
    listen 9010;
    allow 127.0.0.1;
    allow 192.168.8.0/24;
    deny all;

    location ~ ^/(status|ping)$ {
         fastcgi_pass 127.0.0.1:9000;
         fastcgi_param SCRIPT_FILENAME $document_root$fastcgi_script_name;
         include fastcgi_params;
    }
}

nohup php-fpm-exporter --addr 0.0.0.0:9190 --endpoint http://127.0.0.1:9010/status > /tmp/php-fpm-exporter.log 2>&1 &
sudo firewall-cmd --zone=public --add-port=9190/tcp --permanent
firewall-cmd --reload
添加至systemd服务 及开机自启动#
#添加开机自启动
 cat  > /usr/lib/systemd/system/php-fpm-exporter.service <<EOF
[Unit]
Description=php-fpm-exporter
Documentation=https://github.com/hipages/php-fpm_exporter
After=network.target

[Service]
Type=simple
User=root
ExecStart=/usr/local/bin/php-fpm-exporter --addr 0.0.0.0:9190 --endpoint http://127.0.0.1:9010/status
Restart=on-failure

[Install]
WantedBy=multi-user.target
EOF

systemctl daemon-reload && systemctl start php-fpm-exporter && systemctl status php-fpm-exporter
systemctl enable php-fpm-exporter
lsof -i :9090
win_exporter 安装配置#
msiexec /i wmi_exporter-0.7.0-amd64.msi ENABLED_COLLECTORS=cpu,cs,logical_disk,net,os,service,system,textfile,memory,tcp LISTEN_PORT=9010
备份与恢复#
数据备份策略#
完整备份脚本#
cat > prometheus-backup.sh << 'EOF'
#!/bin/bash

PROMETHEUS_DATA="/var/lib/prometheus"
BACKUP_DIR="/backup/prometheus"
RETENTION_DAYS=30
DATE=$(date +%Y%m%d_%H%M%S)

echo "=== Prometheus 备份脚本 ==="
echo "开始时间: $(date)"

## 创建备份目录
mkdir -p "$BACKUP_DIR"

## 创建快照
echo "创建 Prometheus 快照..."
SNAPSHOT_RESPONSE=$(curl -X POST http://localhost:9090/api/v1/admin/tsdb/snapshot)
SNAPSHOT_NAME=$(echo $SNAPSHOT_RESPONSE | jq -r '.data.name')

if [ "$SNAPSHOT_NAME" != "null" ]; then
    echo "快照创建成功: $SNAPSHOT_NAME"

    # 压缩备份
    echo "压缩备份数据..."
    tar -czf "$BACKUP_DIR/prometheus-snapshot-$DATE.tar.gz" \
        -C "$PROMETHEUS_DATA/snapshots" "$SNAPSHOT_NAME"

    # 清理快照
    rm -rf "$PROMETHEUS_DATA/snapshots/$SNAPSHOT_NAME"

    # 备份配置文件
    echo "备份配置文件..."
    tar -czf "$BACKUP_DIR/prometheus-config-$DATE.tar.gz" \
        -C /etc prometheus/

    # 验证备份
    if [ -f "$BACKUP_DIR/prometheus-snapshot-$DATE.tar.gz" ]; then
        BACKUP_SIZE=$(du -h "$BACKUP_DIR/prometheus-snapshot-$DATE.tar.gz" | cut -f1)
        echo "✓ 数据备份完成: prometheus-snapshot-$DATE.tar.gz ($BACKUP_SIZE)"
    fi

    if [ -f "$BACKUP_DIR/prometheus-config-$DATE.tar.gz" ]; then
        CONFIG_SIZE=$(du -h "$BACKUP_DIR/prometheus-config-$DATE.tar.gz" | cut -f1)
        echo "✓ 配置备份完成: prometheus-config-$DATE.tar.gz ($CONFIG_SIZE)"
    fi
else
    echo "✗ 快照创建失败"
    exit 1
fi

## 清理过期备份
echo "清理过期备份..."
find "$BACKUP_DIR" -name "prometheus-snapshot-*.tar.gz" -mtime +$RETENTION_DAYS -delete
find "$BACKUP_DIR" -name "prometheus-config-*.tar.gz" -mtime +$RETENTION_DAYS -delete

echo "=== 备份完成 ==="
EOF

chmod +x prometheus-backup.sh

## 设置定时备份
echo "0 2 * * * /usr/local/bin/prometheus-backup.sh" | crontab -
总结#
部署优势#
通过本指南,您可以成功部署一个企业级的 Prometheus 监控平台,具有以下优势:
技术优势#
- 云原生监控:专为现代化微服务和容器环境设计
- 高性能存储:内置时序数据库,高效压缩和查询
- 强大的查询语言:PromQL 提供灵活的数据分析能力
- 丰富的生态系统:大量 Exporter 和集成工具
- 可扩展架构:支持联邦、分片和高可用部署
运维优势#
- Pull 模式采集:主动拉取,网络拓扑简单
- 服务发现:自动发现和监控动态目标
- 告警管理:灵活的告警规则和通知机制
- 可视化集成:与 Grafana 完美集成
- API 丰富:完整的 REST API 支持自动化
最佳实践#
生产环境建议#
- 容量规划:根据指标数量和保留时间合理规划存储
- 高可用部署:配置 Prometheus 联邦和 AlertManager 集群
- 安全配置:启用 HTTPS、认证和网络隔离
- 监控监控:监控 Prometheus 自身的健康状态
- 备份策略:定期备份配置和关键数据
扩展建议#
- 长期存储:集成 Thanos、Cortex 或 VictoriaMetrics
- 多集群监控:使用联邦或远程读写实现跨集群监控
- 服务网格集成:监控 Istio、Linkerd 等服务网格
- 云原生集成:与 Kubernetes、OpenShift 深度集成
持续改进#
Prometheus 作为监控平台的核心,需要持续优化和改进:
- 定期更新:保持 Prometheus 和相关组件的及时更新
- 性能监控:持续监控系统性能和查询效率
- 告警优化:根据实际情况调整告警规则和阈值
- 用户培训:提供 PromQL 和监控最佳实践培训
通过本指南的配置和最佳实践,您可以构建一个稳定、高效、可扩展的企业级监控平台,为现代化应用和基础设施提供全面的可观测性支持。